News & Articles
EXI and Foerster Team for Magnetometer Survey of Andrew Jackson’s Hermitage Historical Site
During the most recent meeting of the Environmental and Engineering Society in Nashville, TN in March 2018 (SAGEEP), a demonstration opportunity was presented to all exhibitors. Many equipment manufacturers and contractors took advantage of an invitation by the site archaeologists to collect data on the grounds of the Hermitage, President Andrew Jackson’s home.
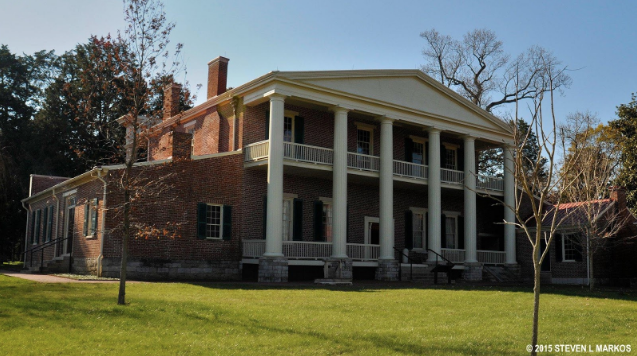
The Hermitage now comprises almost 1,000 acres of the original land owned and cultivated by the Jackson family from 1804 to 1856. Andrew Jackson lived there on and off until his death in 1845. Extensive archaeological work over the years has produced a rich history of the property, including a substantial look at the slave population of the time.
Geophysical data were measured using electrical resistivity, conductivity, ground penetrating radar and magnetometry in the vicinity of “Alfred’s Cabin”.
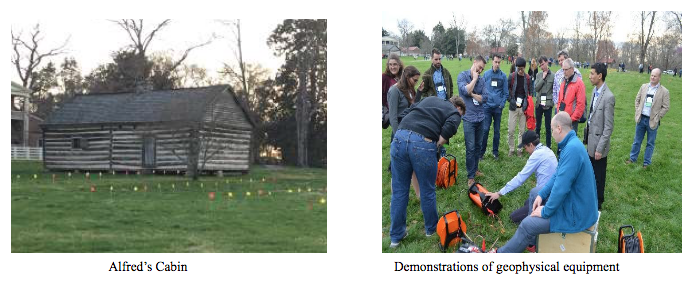
Exploration Instruments teamed with Mario Di Bello (Foerster USA) and Fabian Stickel (Institute Dr. Foerster, Reutingin, Germany) to deploy a 3-probe Ferex 4.034 magnetometer array. Mr. Di Bello and Mr. Stickel collected mag data over a grid in which the other geophysical tools were also employed. The mag data were informally presented to the site archaeologist the next day.
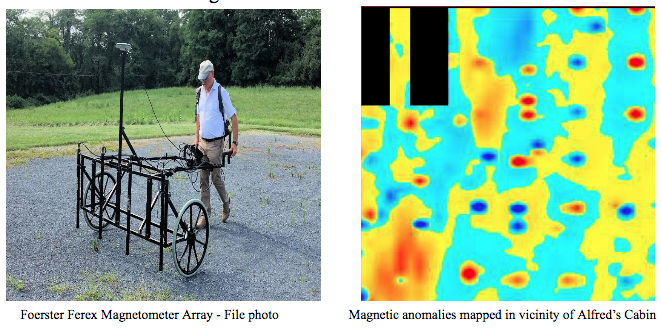
Of great interest were a number of symmetrically-spaced targets that were previously unknown to the site management.
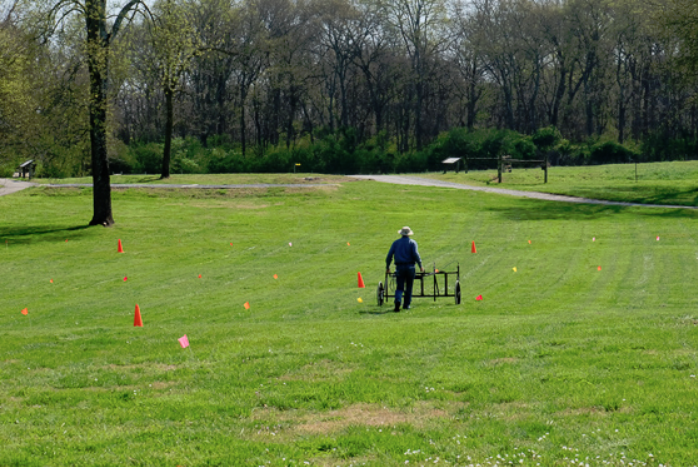
Because the anomalies were new and extended to the edge of the survey area (don’t they always?), William Doll, of Oak Ridge, TN (geophysicist and Chairman of the SAGEEP meeting) volunteered to return to the site and collect additional data sets if the equipment could be made available. Foerster and Exploration Instruments agreed to provide the array and Mr. Doll, along with Gerald Scott of Oak Ridge TN, Hermitage staff member Olivia Thompson, Mt. Juliet TN and geophysicist Corby Schmalz Spring Hill TN, gathered at the Hermitage for the survey.
This second survey made use of a 4-probe array in order to maximize the efficiency of their time on-site. Four different areas were mapped and the data processed using Geosoft Oasis Montaj software.
For those unfamiliar with magnetometry, Dr. Doll provides some information about the mapping of magnetic data and its interpretation:
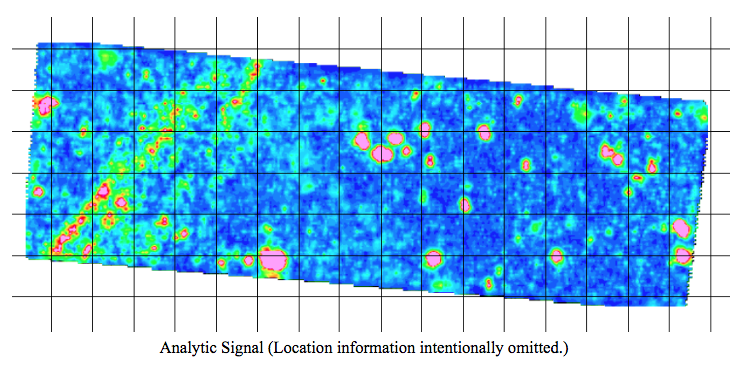
“The vertical component of magnetic field maps will show both a positive and a negative peak for each magnetic object detected. Sometimes one or the other of these peaks will be hidden, as when the anomaly is associated with a vertical steel nail or rebar segment. The actual location of the object will be somewhere between the positive and negative peaks, depending on how the object was magnetized and the three-dimensional orientation of the earth’s magnetic field. To make interpretation and follow-up easier, the geophysicist typically will produce an analytic signal or “total gradient” map as well. This map has no negative values, and the center of each anomaly should lie above the object of interest. Different features may be visible on each of the two maps so both map products are typically provided.
Interpretation of magnetic anomaly maps should be a joint effort of the geophysicist and persons familiar with the history and archaeology of the site. Magnetic anomalies will be associated with one of two types of features: 1) magnetized ferrous metallic objects, such as nails, rebar, or other such items that are not stainless steel, aluminum, copper, or other non-ferrous materials; 2) soils or rocks that contain ferrous or ferromagnetic minerals. This can include clay soils or gravels that have magnetic properties (e.g. NOT limestones or pure sandstones). Fired clay materials, such as bricks or pottery, or fire pits may retain strong magnetic properties associated with orientation of magnetic fields that is reset when the feature cools below the Curie temperature. “
Bill Doll collects magnetometer data using Foerster Ferex array. (Gerald Scott photo)
The originally sampled data set near Alfred’s Cabin was extended and many of the anomalies are attributed to markers from a previous archaeological shovel test pit survey conducted in the early 1990s.
Of the four survey areas, one of the other, more intriguing data sets indicate linear patterns on the western side which do not correlate with known utility lines. Bill says “It’s possible that these represent a previous location of utility lines, but equally possible that they represent something more interesting”.
With the Ferex array, it was possible to sample each data line on 0.5 m line intervals. Each grid required approximately 30 minutes for data collection. Over the course of a day, these intrepid volunteers logged over 11 kilometers of high-density magnetometer data in 4 different grids!
All of the magnetometer data collected have been submitted to the site managers at the Hermitage. Other complementary data sets collected during the Outdoor Demonstration will, hopefully, also be sent to them and then correlated to see if the geophysical picture can enlighten the story that they have pieced together to-date.
The Ferex array is a very cost-effective data collection system if you have a project which requires this kind of detail. Archaeological applications abound, of course, but there may also be geotechnical and UXO projects in need of such efficiency. The array is available for rent from the EXI Harrisburg office.